
Why should you care about reading scientific papers?
An evidence-based approach to management allows organizations to select and utilize strategies that have been empirically tested by multiple research teams. Unfortunately, much of the available scientific literature is written in a manner that is challenging or confusing to non-scientists. However, by developing several key research-consumption skills, you can more effectively read & interpret findings from social science, and apply them to your own management practice (Bem, 1987).
In this CQ Dossier, the foundation of understanding science and reading scientific papers will be discussed: knowledge of how to prove cause & effect, basic statistical awareness, and an understanding of science as tentative and self-correcting.
Contents
- Why should you care about reading scientific papers?
- Understanding science: Knowledge is tentative, self-correcting and open to revisions
- Proving cause and effect: Correlation is not causation
- Basic statistical knowledge to read scientific papers
- Evidence-based managers accept that scientific knowledge is never final
- Key recommendations for professionals
- References and further reading
Understanding science: Knowledge is tentative, self-correcting and open to revisions
Scientific conclusions are tentative, and always open to revision as new data comes in (Dunn, 2009). This is doubly true when studying something as mutable and complex as human psychology. Results that were once valid may become invalid as technological and cultural changes occur.
An intervention that is successful in one organization may not be have an effect in another organization. Given this reality, you will never find evidence-based recommendations that are guaranteed to be successful or universally applicable to all situations.
The constantly-evolving, tentative nature of science can be frustrating if you are in search of a clear-cut answer to an organizational problem. It is vital, then, that adopt a mindset that embraces ongoing research. Science cannot promise a resolved, categorical answer to a question, or promise that a strategy is the “best”.
It can, however, document the situations and organizations in which an intervention worked, and provide an explanation of why the intervention may have worked (Paul, 1991). This information can be used to help you select strategies that fit your organization and its needs.
Proving cause and effect: Correlation is not causation
You are probably familiar with the adage correlation is not causation. In other words, finding an association between two events is not sufficient proof that one event caused the other. Within an organization, it can be very difficult to establish that a favorable outcome occurred because of an intervention, and not due to other factors, such as personnel changes, economic and political events, or even random chance.
How can a researcher prove that an intervention did have a causal influence on desired outcomes? The three conditions correlation, precedence in time and ruling out alternatives must be met (Russel, 1912; Chalmers, 1979):
1. Correlation
First, there must be a correlation between the intervention and the outcome. Correlation is not necessarily causation, it’s true, but correlation is a necessary precondition to proving a causal relationship. Salary cannot be proven to influence job satisfaction, for example, if you find no relationship whatsoever between how much an employee makes and how satisfied they are.
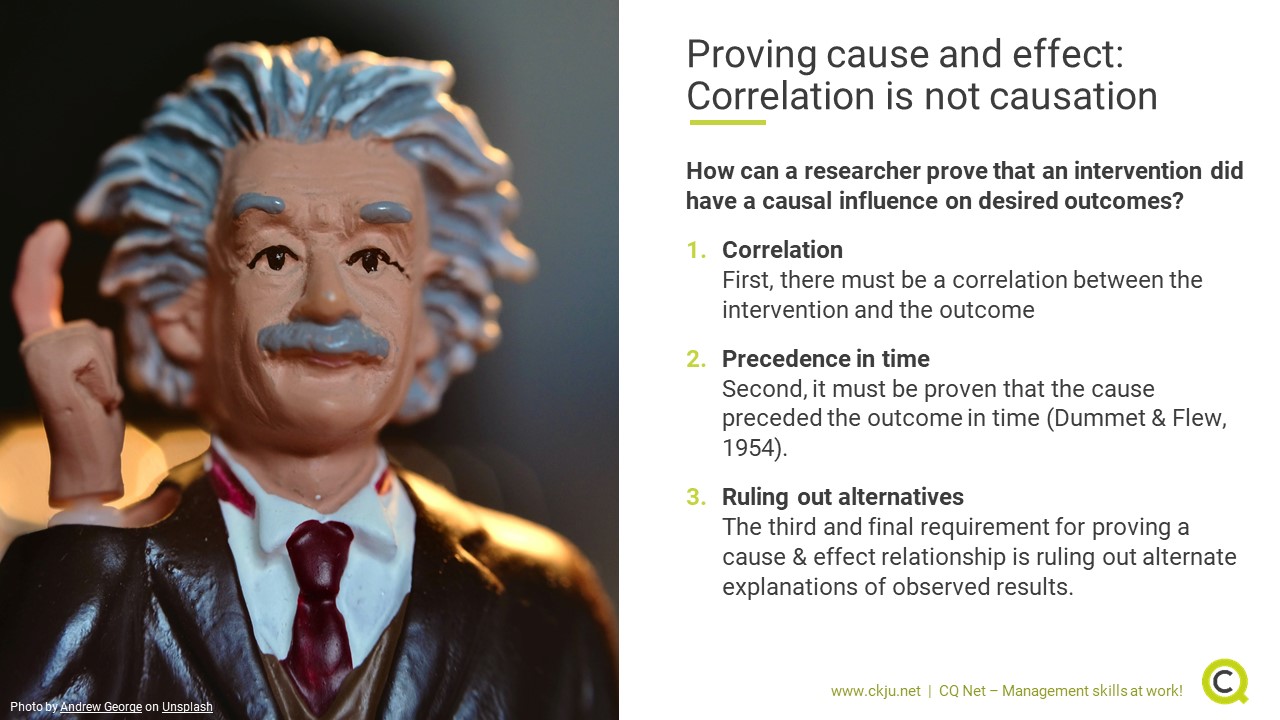
2. Precedence in time
Second, it must be proven that the cause preceded the outcome in time (Dummet & Flew, 1954). For example, no one can claim that a new manager caused an increase in productivity if productivity was already on the rise before the manager was brought in.
Proving temporal precedence requires measuring outcomes at multiple points in time, including prior to enacting a change or introducing an intervention. This is also the reason why longitudinal research studies rank higher in evidence hierarchies than cross-sectional research studies.
3. Ruling out alternatives
The third and final requirement for proving a cause & effect relationship is ruling out alternate explanations of observed results. This requires critical thinking and an intimate knowledge of how an organization functions.
An effective researcher must recognize & control for any outside factors that could lead to the illusion of a cause and effect relationship. If sensible alternative explanations have not been tested & ruled out, then a researcher does not have airtight proof that their intervention caused any changes that were observed.
Basic statistical knowledge to read scientific papers
The Results section of a published scientific paper is by far the most intimidating for a non-scientist to read. However, this section contains essential details on a study’s sample demographics and the magnitude and significance of observed effects, and should not be skipped or skimmed.
You do not need to be a statistical expert to find the information in this section useful and interpretable. You do, however, need to brush up on some basic statistical terminology and concepts:
Basic descriptive statistics
Descriptive statistics provide the reader with a snapshot of what a sample’s data looks like. The most commonly provided descriptive statistics are the mean (the statistical average), written as M, and the standard deviation (an estimate of variability), written as SD.
These two statistics can provide you with a sense of what the average person in the sample was like, and how diverse the sample’s scores were. Just remember: a large standard deviation indicates there was a great deal of variation or diversity in scores.
Having a basic understanding of statistics is the foundation of effective management intervention. Learn the basics of statistics for management in our CQ Dossier Understanding science: Introduction to statistics for management practitioners.
Basic inferential statistics
Inferential statistics are used to test scientific hypotheses. The specific statistic that a research uses will align with
- the type of data the researcher has collected, and
- the nature of the research question being asked (Dyer, 1995).
For example, a correlation examines linear relationships between two variables; a t-test, in contrast, is used to compare the averages of two distinct groups of people (for example, a control group and a treatment group).
It can be immensely beneficial to review an introductory statistics book and learn when various statistical tests are utilized. Key statistics to brush up on include:
- t-tests,
- z-tests,
- correlations,
- linear regression, and
- analysis of variance (ANOVA).
Knowledge of statistical formulas is not necessary; what you should review is what, conceptually, each statistic is capable of testing. Grasping the basics of what a statistical test does will help you interpret a researcher’s hypotheses, methods, and findings more clearly.
Evidence-based managers accept that scientific knowledge is never final
To become a capable consumer of evidence-based research, you must accept & embrace the fact that scientific knowledge is never final. Every new study presents a potential challenge to our current understanding of the world and how organizations function. New data may call old findings into question; these revisions should be celebrated rather than feared.
As theories are refined and additional information is collected, the scientific literature gets closer and closer to an accurate picture of reality. This process will never cease, but it will continuously improve.
If you are comfortable reading and critically analyzing scientific research, you will come to see this as an exciting benefit of taking an evidence-based approach, and a reason to keep reading the latest literature on a regular basis.
Key recommendations for professionals
- An evidence-based approach to management requires that you consume published, scientific research
- While published research is tailored to an academic audience, it can be understood and interpreted by a non-scientist with certain basic skills
- Proving cause & effect relationships between variables requires proof of correlation and temporal precedence, as well as the ruling out of alternative explanations
- It is helpful to understand the basics of when and why inferential statistical tests are used
- Scientific conclusions are never final, and are always subject to revision; you should continually update your knowledge by reading new research
Management skills newsletter
Join our monthly newsletter to receive management tips, tricks and insights directly into your inbox!
References and further reading
Bern, D. (1987). Writing the empirical journal. In Darley, J. M., Zanna, M. P., & Roediger III, H. L. (Eds) (2002). The Compleat Academic: A Career Guide. Washington, DC: American Psychological Association.
Chalmers, A. F. (1979). What is this Thing Called Science?: An Assessment of the Nature and Status of Science and Its Methods. University of Queensland Press.
Dummett, A. E., & Flew, A. (1954). Symposium: Can an Effect Precede Its Cause? Proceedings of the Aristotelian Society, Supplementary Volumes, 27-62.
Dunn, D. S. (2009). Research methods for social psychology. Wiley-Blackwell.
Dyer, C. (1995). Beginning research in psychology: A practical guide to research methods and statistics. Blackwell Publishing.
Paul, E. R. (1991). Science: "Forever Tentative?". Dialogue, 24, 119-123.
Russell, B. (1912, January). On the notion of cause. In Proceedings of the Aristotelian society (Vol. 13, pp. 1-26). Aristotelian Society, Wiley.