
How KPI Software Improves Executive Decision-Making?
Contents
- Why Executive Decision-Making Needs More Than Reporting?
- 1. KPI Software Creates a Shared Performance Language
- 2. From KPI Visibility to Business Performance Management
- 3. Deviation Management Software Helps Leaders Act Before Problems Escalate
- 4. Turning Dashboards into Evidence Based Management
- 5. The Executive Advantage: Less Searching, More Deciding
- What Executives Should Look for in KPI Software?
- A Better Model for Executive Performance Reviews
- From Knowing What Happened to Knowing What to Do
A quarterly performance review is supposed to make things clearer. The numbers are on the table, yet, for many leadership teams, the discussion does not become easier simply because more information is available. One KPI is above target, another has started to decline, and a third looks stable, at least on the surface. Finance may be highlighting margin pressure, while sales is focused on pipeline growth. Operations may be pointing to capacity constraints, and a business unit leader may be explaining why a strategic initiative is taking longer than expected. Individually, each piece of information makes sense. The challenge is understanding how they fit together. That is where executive decision-making becomes difficult.
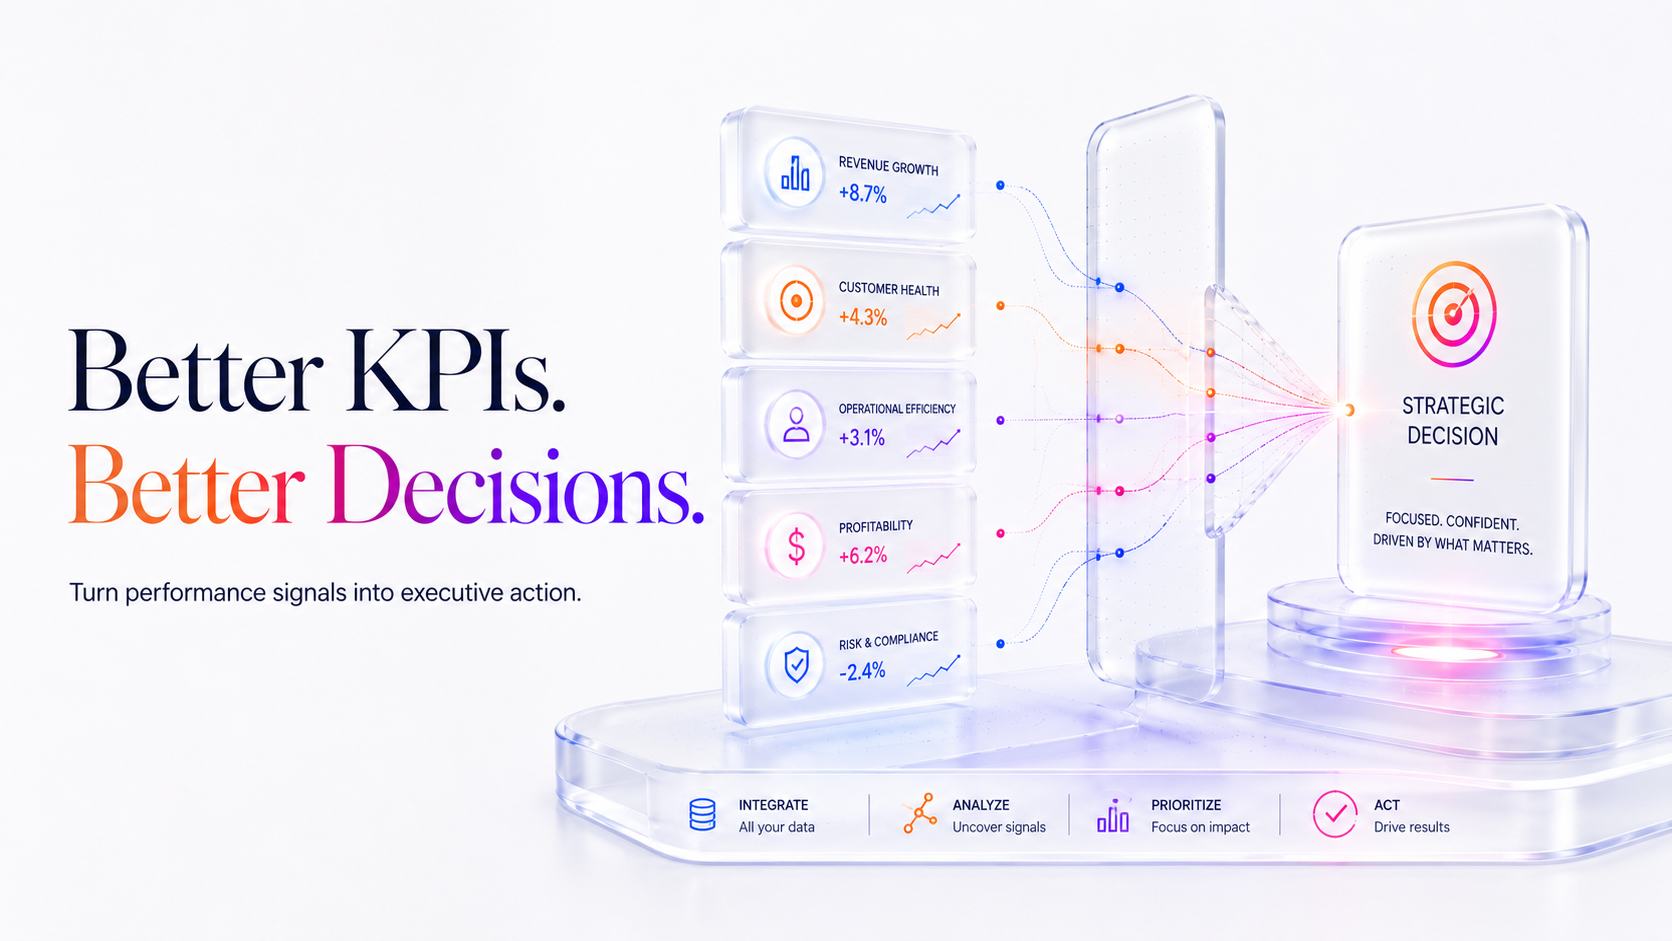
The real question is rarely “What are our numbers?” Most leadership teams already have an answer. The bigger questions are: What is changing? Why is it changing? Which deviations actually matter? And where should we act first? A single consolidated space where you can get these answers is KPI software. It can change the nature of the conversation. Instead of treating KPIs as isolated numbers in a reporting process, modern platforms can bring targets, actual performance, trends, deviations and business context together.
Why Executive Decision-Making Needs More Than Reporting?
This is the point at which the difference between reporting performance and managing performance becomes clear. A traditional management report can tell an executive that revenue is 8% below target. It may even show that the deviation emerged during the previous quarter. But that information alone does not answer the questions leadership actually needs to resolve. Is the issue concentrated in one market? Has customer acquisition slowed? Has pricing changed? Are certain products underperforming? Is the problem temporary, or is it connected to a broader strategic trend?
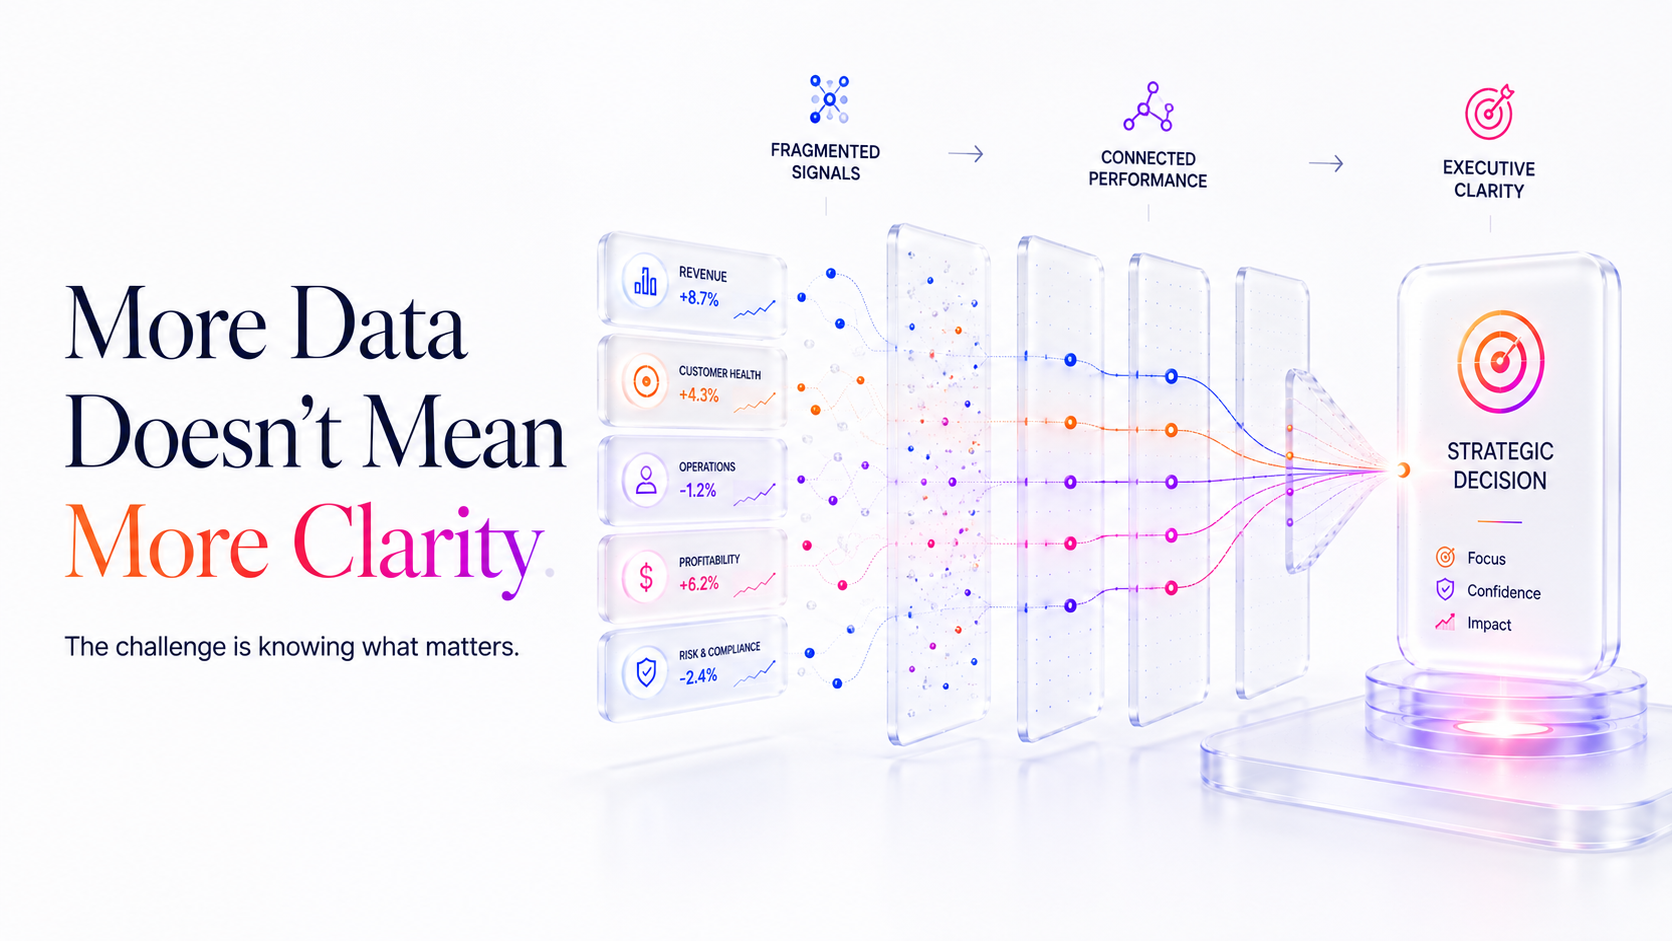
The number identifies the signal. The decision requires context. This is why simply adding more reporting rarely solves the underlying problem. When information remains fragmented, executives are still required to connect the dots themselves. A well-designed KPI dashboard software environment changes that starting point. Instead of beginning a performance discussion with “What happened?”, leadership can move more quickly towards questions such as:
- Which strategic objectives are currently at risk?
- Which KPIs are moving materially away from the target?
- What business drivers are contributing to the deviation?
- Which issues require executive attention now?
- What actions are already underway, and are they producing results?
And it sets up the next question: once leaders can see the important KPIs clearly, how do they understand what those KPIs are actually telling them about the business? It is exactly where business performance management enters the picture.
1. KPI Software Creates a Shared Performance Language
One of the most practical advantages of KPI software is its ability to give leadership teams a common reference point. In complex organizations, different departments naturally develop their own ways of measuring performance. These metrics all matter. The challenge begins when they are viewed independently.
A centralized KPI environment can establish a consistent structure around the metrics that matter most to the organization. Targets can be defined, actual performance can be compared against expectations, and relevant stakeholders can work from the same underlying picture.
This changes the nature of a management discussion. Instead of debating whose spreadsheet reflects reality, leadership can spend more time asking what the performance data means and what response is appropriate. That is particularly useful for DACH companies with multiple subsidiaries, business units or markets. Local teams still need the metrics relevant to their operations, but senior leadership also needs a way to understand how those individual results contribute to broader strategic objectives.
The goal is not to make every department measure everything the exact same way. It is to create enough consistency for the organization to have a meaningful conversation about overall performance.
2. From KPI Visibility to Business Performance Management
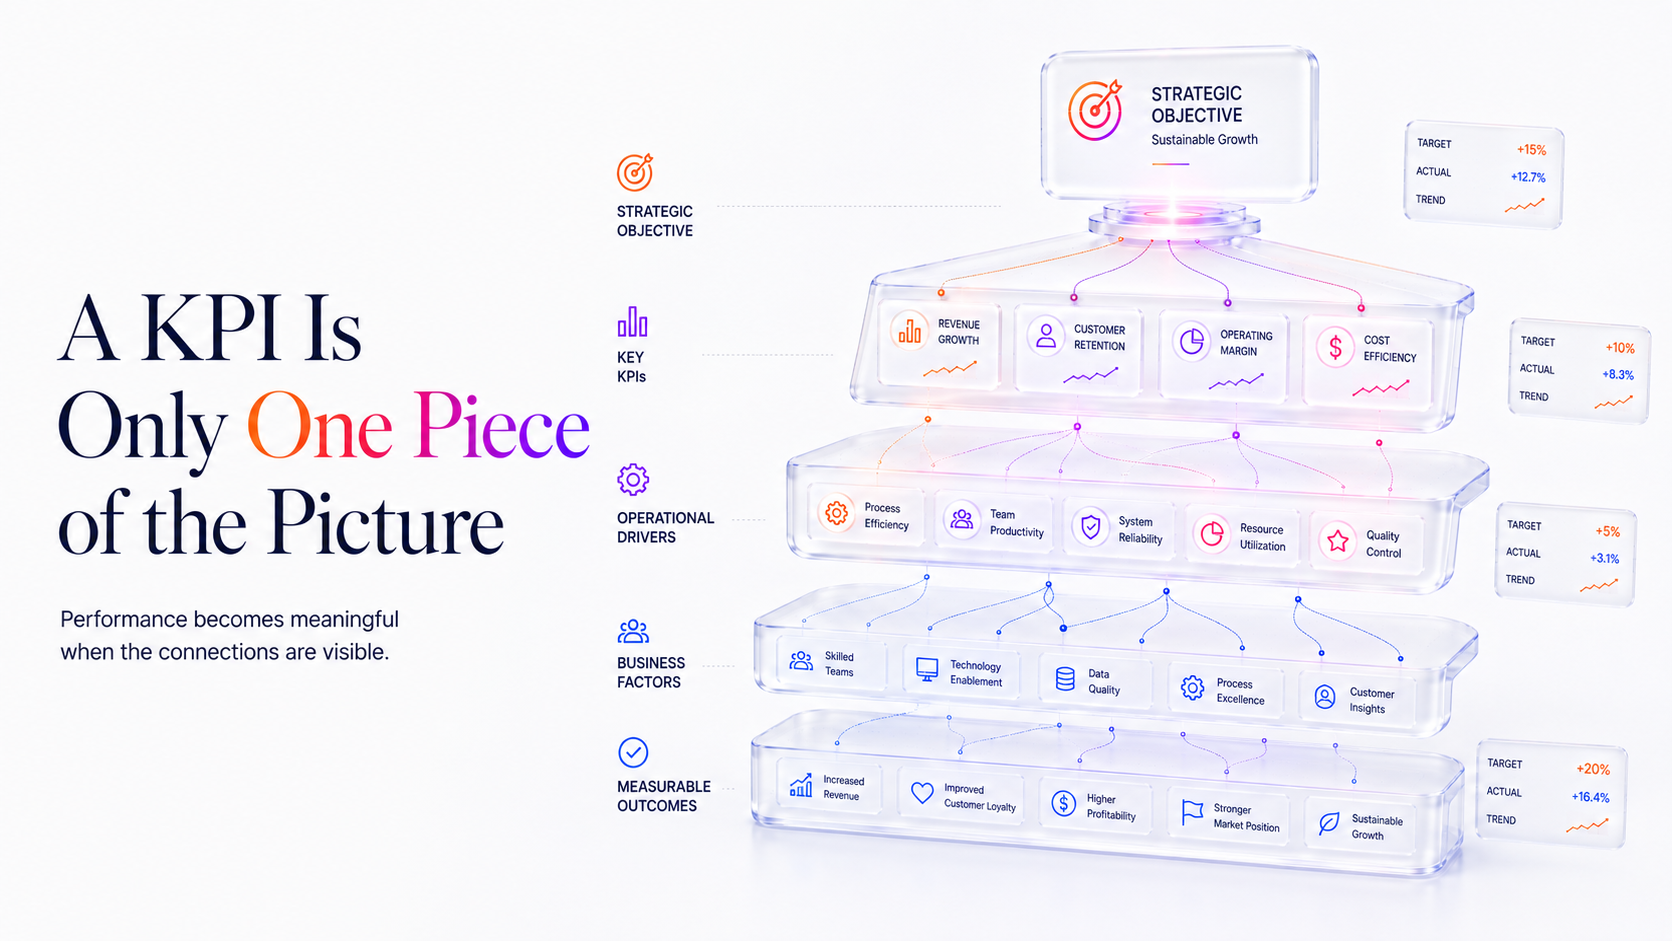
Seeing a KPI is useful. Understanding its relationship with the wider business is far more powerful. Hence, business performance management becomes important. A KPI rarely exists in isolation. Revenue growth, for example, can be influenced by customer acquisition, retention, pricing, product mix and regional performance. Delivery performance can be affected by capacity, supplier reliability, process efficiency and resource availability. When these relationships remain hidden, executives can end up treating symptoms rather than causes. Consider a simple example:
|
|
|
|
|
|
|
|
|
|
|
|
|
|
|
The difference is subtle but important. A dashboard that simply says “revenue is down” provides information.
A performance environment that helps answer “where, why and what should we do?” provides decision support. This is also consistent with the broader direction of modern dashboard design. Gartner's 2026 research argues that dashboards intended to support decision-making need decision, driver and data context rather than functioning purely as reporting tools.
For executives, this means the value of business performance management is not simply having more information in one place. It is being able to understand how objectives, KPIs, initiatives and operational drivers interact. That is the point at which a performance dashboard starts becoming a management tool rather than another reporting interface.
3. Deviation Management Software Helps Leaders Act Before Problems Escalate
Once performance is visible and connected to broader objectives, another question becomes important:
When should leadership intervene?
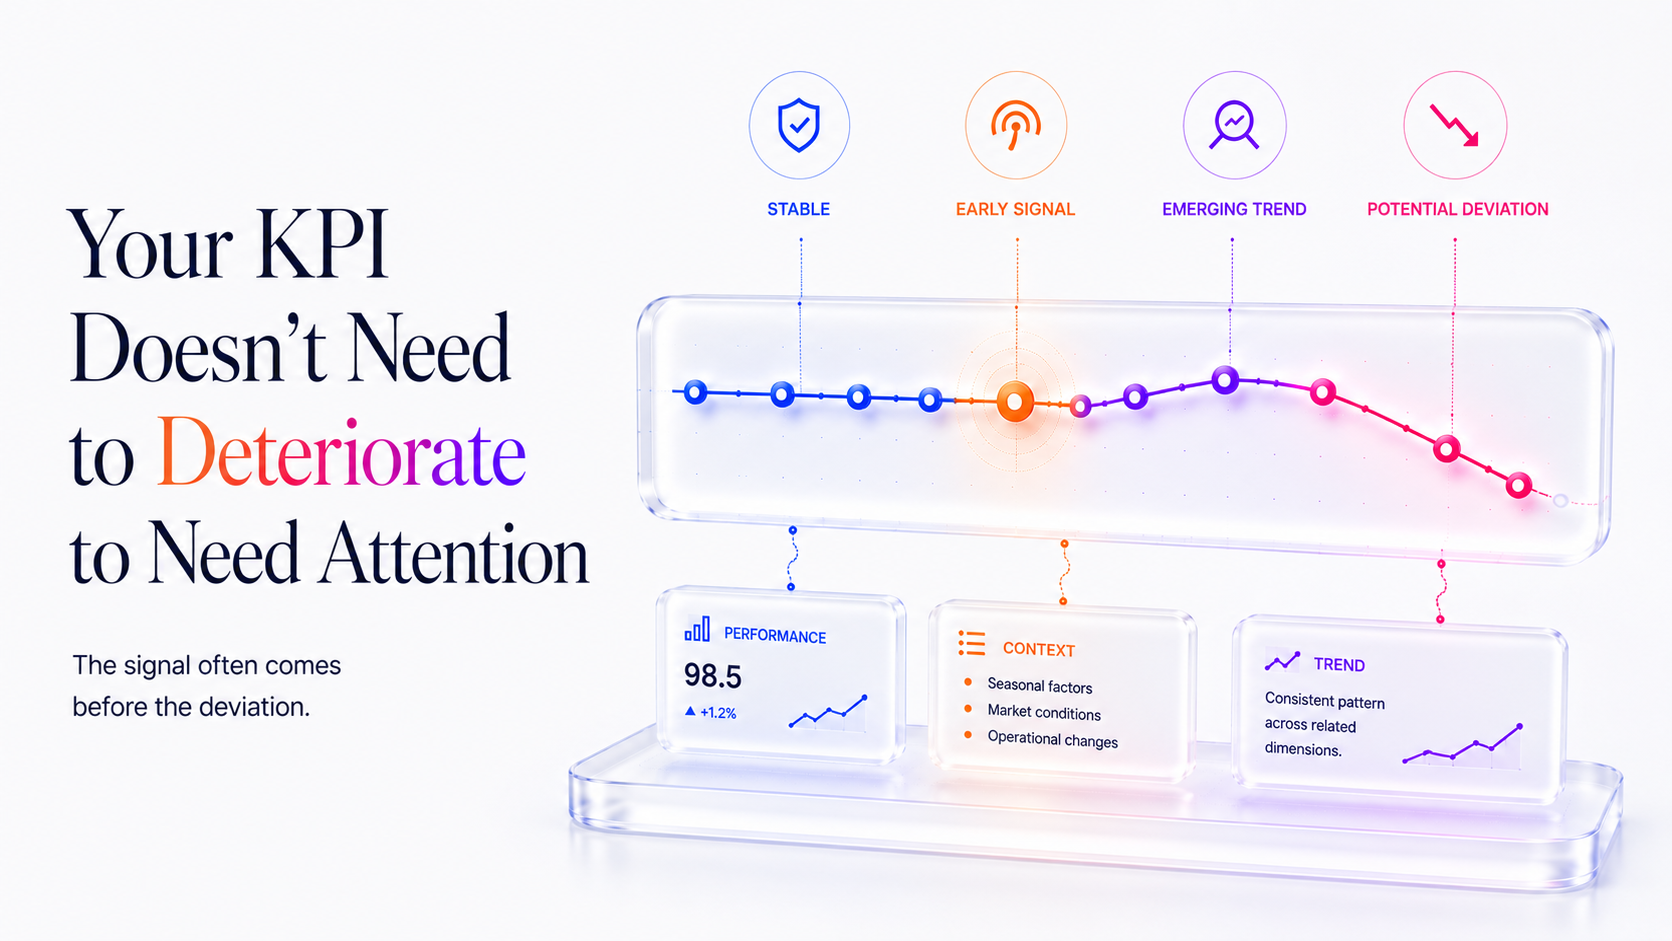
Not every variation deserves an executive response. Businesses naturally fluctuate. Sales can move from one month to another. Operational metrics can vary because of seasonality. A single missed target does not necessarily indicate a structural problem. The challenge is identifying the deviations that genuinely matter.
This is where deviation management software can provide a more structured approach. Instead of waiting for the end of a reporting period to discover that an objective has moved significantly away from its expected trajectory, organizations can establish clear targets and monitor meaningful deviations as part of an ongoing management process.
The executive conversation can then follow a simple logic:
1. What has deviated?
Identify the KPI, objective or performance measure that has moved away from its expected level.
2. Why has it deviated?
Examine the relevant drivers, dependencies, business context or underlying causes.
3. What should happen next?
Agree on an appropriate response, assign ownership and establish follow-up.
This is considerably more useful than simply marking a metric red. A deteriorating KPI tells leadership that something requires attention. A connected deviation process helps leadership understand what requires attention, why it matters and what happens next.
4. Turning Dashboards into Evidence Based Management
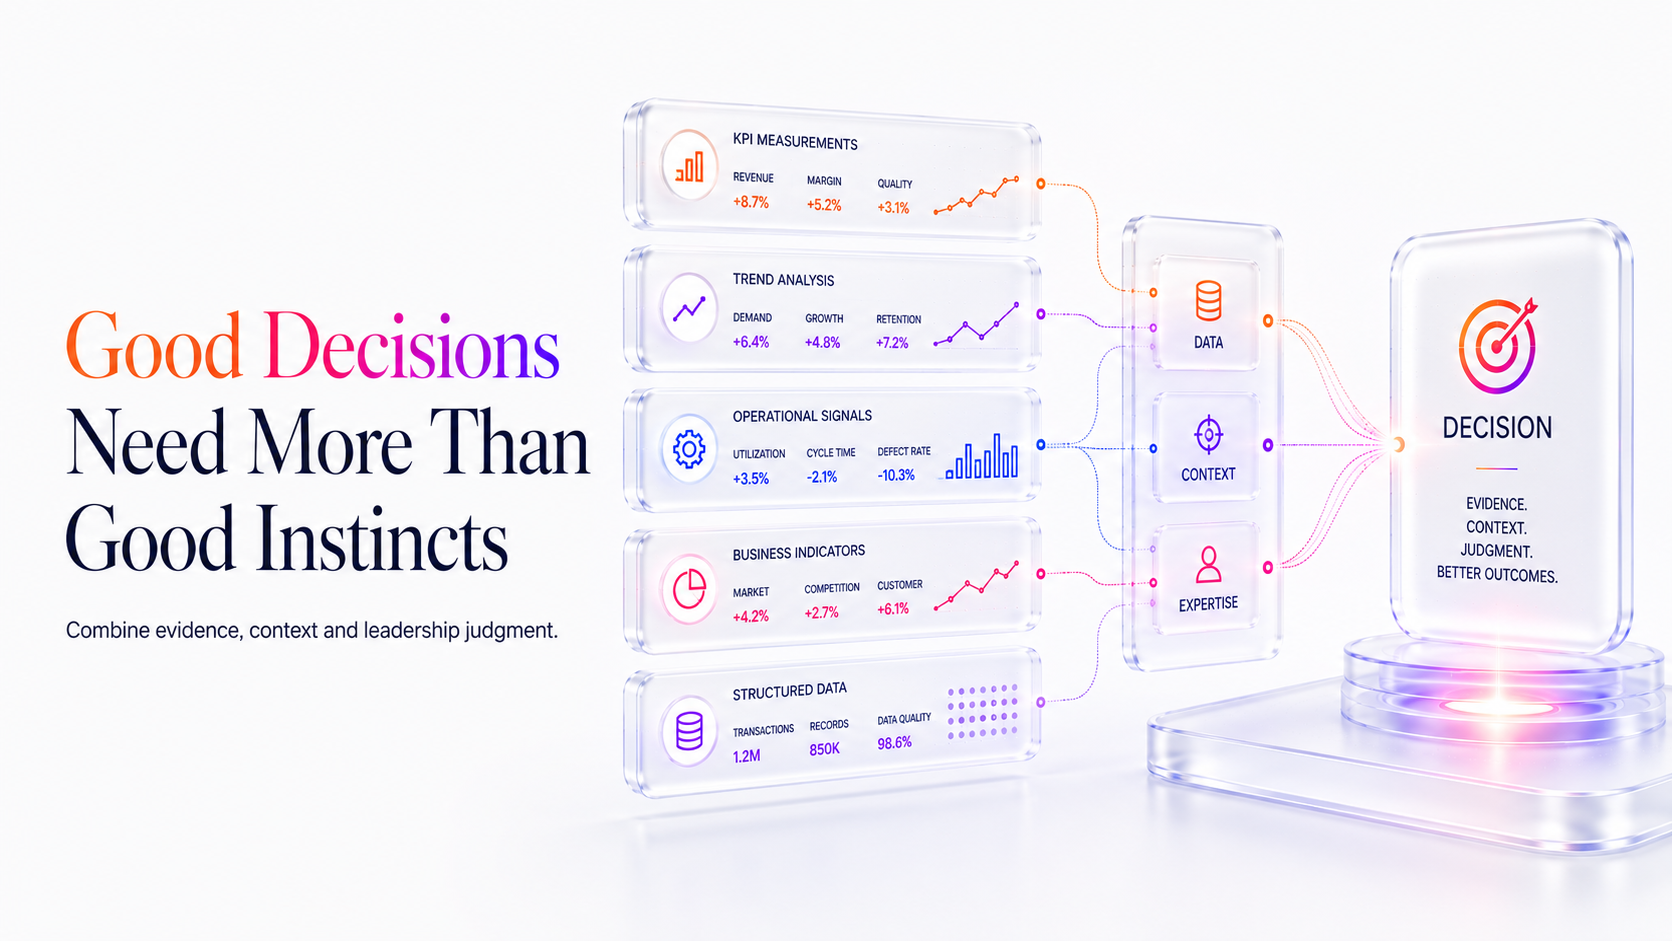
Better visibility does not automatically guarantee better decisions. Leadership teams still need to interpret information, challenge assumptions and consider context. A dashboard cannot decide what the organization should do. It can, however, improve the quality of the evidence available when that decision is being made.
Evidence Based Management is highly relevant because of this. The Center for Evidence-Based Management describes evidence-based decision-making as the conscientious use of the best available evidence from multiple sources. Importantly, that evidence is not limited to organizational data; it can also include scientific research, professional expertise and stakeholder perspectives. That distinction matters.
The purpose of evidence should always be to help leadership test assumptions. Suppose an executive team is deciding whether to increase investment in a strategic initiative. Without a holistic perspective on the current performance that relies on a set of interconnected metrics and contextual variables, the discussion may depend heavily on individual perspectives:
“Sales believes the initiative is working.”
“Operations thinks implementation is too complex.”
“Finance believes the investment should be reduced.”
With a stronger performance environment, the questions become more precise:
- Which outcomes have actually changed?
- Which KPIs have improved?
- Where are those improvements occurring?
- Which targets remain off track?
- What evidence supports increasing or reducing investment?
- What additional information would reduce uncertainty?
This does not remove experience or professional judgment from the decision. It strengthens them. CEBMa also emphasizes that evidence needs to be interpreted within context and assessed for its reliability and relevance. That is an important principle for executives: data should inform judgment, not replace it.
A modern KPI software platform can support this approach by making relevant organizational evidence easier to access when decisions are being considered. In addtion, it also should provide access to additional sources of evidence e.g. from scientific research papers. This can be achieved by integrating an AI agent into the software that helps leaders to esily get an overview of the state of research related to a specific topic.
5. The Executive Advantage: Less Searching, More Deciding
Ultimately, the value of KPI dashboard software is not the dashboard itself. It is what the dashboard enables leadership to do. Executives should not have to spend a significant portion of every performance meeting searching through spreadsheets, comparing report versions or asking different teams to explain where a number came from. A well-designed performance environment should shorten the distance between information and action. A useful way to think about this is:
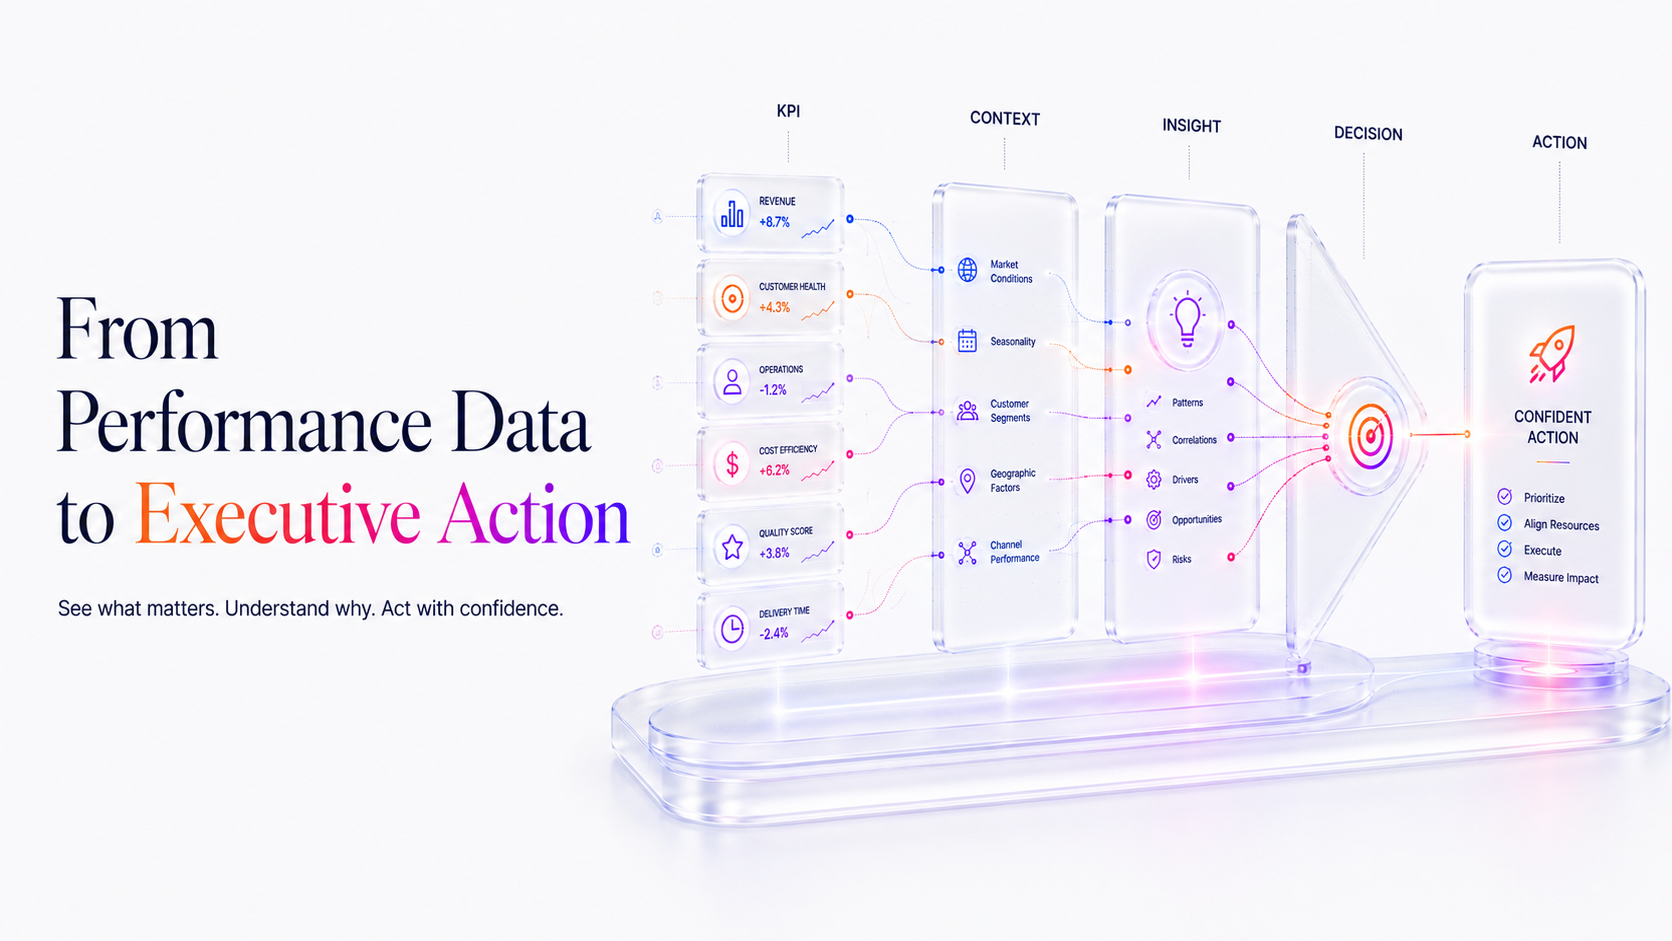
Strategy → KPI → Target → Actual Performance → Deviation → Driver → Action → Follow-up
This creates a continuous management cycle rather than a reporting cycle. It also changes the quality of executive meetings. Instead of spending the opening part of the meeting establishing what happened, leaders can move more quickly towards:
What does this mean?
What is causing it?
What decision is required?
Who needs to act?
How will we know whether the action worked?
That is a much more productive use of executive attention. Recent Gartner research similarly highlights the limitations of dashboards that are disconnected from actionable decision processes, reinforcing the move towards dashboards designed around decisions and business context.
What Executives Should Look for in KPI Software?
Not every dashboard platform will improve executive decision-making. A visually impressive dashboard can still be difficult to use if it contains too many metrics, lacks context or does not connect performance information with action. When evaluating KPI software, leadership teams should therefore look beyond the number of charts and ask whether the platform supports the actual management process.
|
|
|
|
|
|
|
|
|
|
|
|
|
|
|
|
|
|
|
|
|
The most useful platform is rarely the one that shows the most data. It is the one that helps leaders identify the right data, in the right context, at the right moment in the decision process. This is why business performance management should be treated as an ongoing leadership discipline rather than simply another software category.
A Better Model for Executive Performance Reviews
Once performance information is structured properly, executive reviews do not need to become more complicated. They can actually become simpler. A practical approach is to organize performance discussions around three layers:
- Performance: What is happening?
- Context: Why is it happening?
- Action: What are we going to do about it?
This structure prevents the dashboard from becoming the meeting itself. The technology provides visibility and context. Leadership provides interpretation, prioritization and accountability. This is also where a platform like AgilityVisual can naturally fit into the management process. Rather than treating strategy, KPIs, initiatives and operational information as separate reporting streams, its approach is designed around creating a connected view of business performance and making deviations and actions easier to manage. The result is a more practical approach to performance management. Data is not simply reviewed after the fact, but becomes part of an ongoing cycle of decision, action and follow-up.
From Knowing What Happened to Knowing What to Do
Executive decision-making does not improve simply because an organization has more data. It improves when leaders can distinguish what matters, understand why performance is changing and act while there is still an opportunity to influence the outcome. That is the real opportunity behind modern KPI software.
AgilityVisual is built around this approach, helping organizations connect performance information with strategic objectives, visualize KPIs and deviations, and create a clearer path from insight to action. If your leadership team is spending more time collecting and reconciling performance information than acting on it, it may be time to rethink how performance is managed.